This is an article in our new series exploring and explaining the concepts that underlie our research. Many of our projects integrate highly involved, deeply technical theories and methods, which can be hard to understand without proper training. These posts are intended to break down those abstractions and put them in context.
The development of increasingly advanced computers is perhaps the most important factor for the transformation of scientific research over the last century. Basic training in almost every field of the natural sciences today requires some knowledge or understanding of simulation, and the behavioral and social sciences are not far behind. Many of our projects here at the Center for Mind and Culture utilize computational modeling and simulation. But what is a model, and when and why are they useful in scientific research?
Let’s start with a basic axiom: a model is a simplified representation of reality that is useful for conveying information or getting a better understanding of a natural or social system. This definition may sound somewhat technical or complex at first glance, but the concept is actually very simple. Let’s look at an example of a model that everyone is familiar with.
![]()
That’s right! One of the most basic types of models we use all the time are maps. The map on the right is massively simplified from the earthy landscape it represents, but it is a representation that many of us employ to think about the area of the contiguous 48 states within the United States.
The same things that make a good map also make for a good model. In the case of this map, we would probably conclude that it is not very useful. Let’s look at another map to understand why.
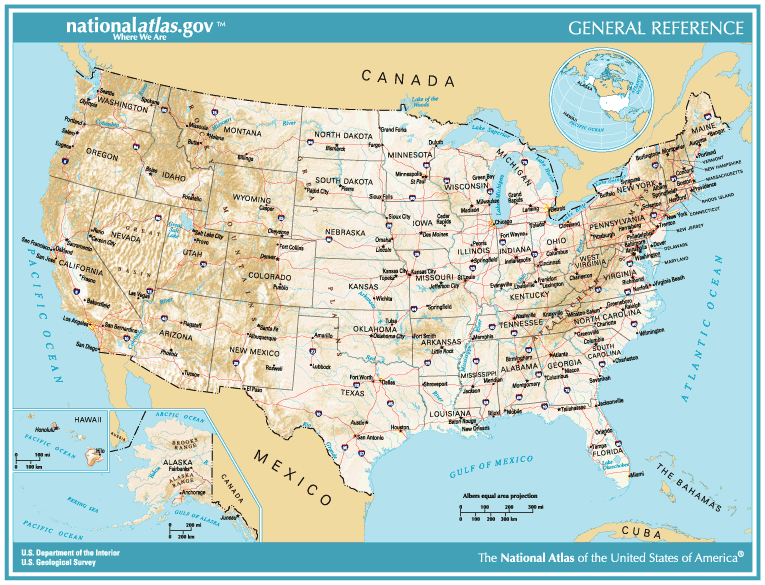
This is a much more useful map of the same landmass. It tells us where it is in relation to other nations and continents, what kind of internal political borders it has, what size it is, and even some information about its topography and the relative elevation of different areas. Is this map more “true” or real than the previous one? Not necessarily. There is more information, but the data shown here is being selected against a nearly unlimited stock of other data that could show up on this map, such as climate details, county borders, cultural groups, hiking trails, and so on.
But would including all of those data points make it a better map, or just make it too complicated and messy to read? Choosing what to include is a matter of weighing the trade-offs between simplification and usefulness, and ultimately depends on what the map is for. The classic articulation of this idea comes from George Box, who famously quipped “all models are wrong, but some are useful.” The real world version is always the most complex system; the goal in modeling is to create tools and representations simple enough for humans to test, manipulate, and interpret.
System Dynamics Modeling
Let’s say we want to predict the population change of two different species that we know have a predator-prey ecological relationship, such as wolves and deer. We might have the intuition that as the number of deer increases, the number of wolves will also increase, since there is more food for the wolves to consume. But then we would also have to consider that as the number of wolves increase, the number of deer will eventually begin to decrease, since there are so many wolves eating them, which in turn will lead to the number of wolves eventually decreasing, which would cause the deer to grow in numbers, and the cycle would start again. If we plotted these numbers it might look like this:
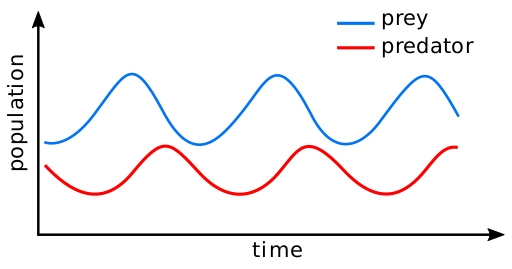
This is a classic model in ecology called the Lotka-Volterra Predator-Prey Model. Even though it is quite simple, it still qualifies as a system dynamic model because it models the relationship between system-level variables (i.e. population totals) over time.
This graph exemplifies a number of core principles of modeling a biological system. First, it zeroes in on two quantitative measures, intentionally omitting the complex backdrop of the rest of the ecosystem (e.g. it includes no weather patterns such as droughts that would hurt all animal populations). Second, and more critically, Lotka-Volterra gives us an example of a feedback loop, a central concept in systems modeling. Feedback refers to what makes a relationship non-linear. Nonlinearity occurs when two variables are not independent from each other over time, but mutually instead influence one another as they change. The populations above are a clear example, because the number of wolves or deer at any given time is dependent on the number of the other population, and they continue to affect each other at every time-step. This concept distinguishes system dynamics modeling from more conventional statistics, which often requires that variables have a linear relationship, or that one variable is “independent” and the other is “dependent” in a linear or some other simple way.
Organizing a System Dynamics Model
Unlike an Agent Based Model, which simulates the activity of thousands of “individuals,” the basic unit of organization for system dynamics models are variables — and primarily variables that are quantitative (expressed in numbers). In fact, system dynamics models can always be expressed as a set of equations. We use system dynamics modeling when the number of variables or the complexity of their relationships is too difficult for us to try to analyze or interpret on our own. Rather than working through relationships mathematically, you create a system in which the connections between different variables are clearly defined, and then you run experiments to see what kind of outputs you get with varied inputs. A systems dynamic model of Predator-Prey might look like this. The diagram may look confusing at first, but we’ll walk through it below.
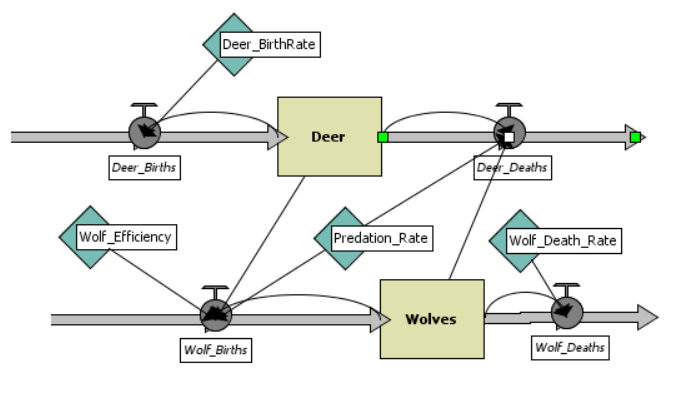
The first advantage of a system dynamics model over equations is the way it translates strings of numbers and letters into clear maps of icons, enabling us to sort through relationships visually.
There are three types of variables that are usually found in a system dynamics model. The first are called state variables, and they refer to the current quantities of different elements of the system. In the example above the state variables are the squares; they refer to how many Deer or Wolves we have at any time step. State variables are connected to flows in the system, which have the “pump” icon above. You can think of flows as faucets or drains in a sink; they define how in the model the state variables accumulate more value and how they lose it. Flows are determined by the second kind of variable, the control variables. Control variables define the rate of change in the system — they could be birth rates, or the rate of water flowing through a set of pipes, etc. Let’s say above that we defined the Deer Birth rate as 0.3, i.e. at every time step there are 3 deer born for every 10 deer in the simulation. The number of deer births is therefore defined as:
“Deer_Births = Deer * Deer_BirthRate”
While the Birth Rate is constant at every step, it is being applied to the ever changing population of the deer, which then increases based on that population number. This is a key feature of system dynamics models: the flow of numbers, equations, and variables is always shifting in relation to the state of the model. You can build extremely intricate and complex systems of relationships using just these two basic variable types, state and control. More complex models use a third type of variable, sometimes called transforming variables, which can modify the control variables over time. I will not be going into transforming variables here but if you are curious about more complicated aspects of dynamic systems modeling, you could consult the textbook Modeling Dynamic Biological Systems by Bruce Hannon and Matthias Ruth (2014).
System dynamics models, and simulation at large, can look intimidating to someone unfamiliar with the lingo. Some of these models can be rather complex, too, which complicates the task of understanding. It helps to keep in mind that these methods were developed to help simplify and gain traction on the intense complexity of the natural and social world. Modeling a complex dynamic system enables us to clarify our ideas about relationships and test the entanglement between combinations of variables until we discover what structure most closely resembles the world we are trying to understand. After all, every time you use a map or a graph, you are already a modeler! System dynamics modeling is yet another way to create useful and powerful representations that enable us to better navigate the forces and flows that define our world.
Wilensky, U. (2005). NetLogo Wolf Sheep Predation (Docked Hybrid) model. http://ccl.northwestern.edu/netlogo/models/WolfSheepPredation(DockedHybrid). Center for Connected Learning and Computer-Based Modeling, Northwestern University, Evanston, IL.
For any inquiries or comments, please email admin@mindandculture.org.