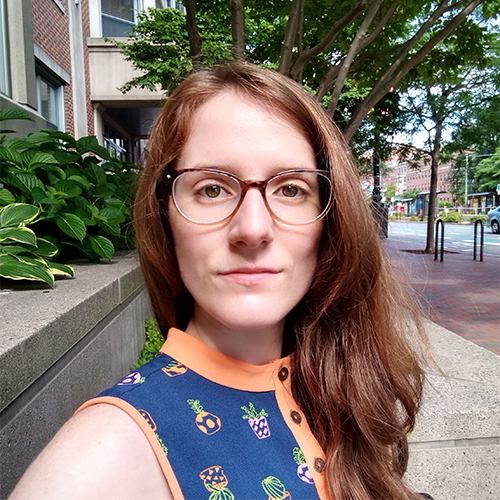
In the summer of 2020, CMAC brought on our first full-time demographer, Rachel Bacon. Rachel is working on the Modeling Religious Change project, adapting traditional demography methods to cooperate with cutting edge methods in computational simulation. Following the release of the 2020 U.S. Census data, we asked Rachel about what this data means for a demographer, and specifically for a religious demographer.
Tell us about your background and your path in academia. What’s led you to where you are and what your research interests are today?

My academic research comes back to two things: my interest in maps and my Seventh-day Adventist upbringing. Growing up, I would spend hours looking through atlases and almanacs that illustrated the demographic characteristics of people across the globe. It seemed natural to be a geography major when I started as an undergraduate at the University of Delaware, but the geography department there focused on rocks and weather patterns instead of people. Adding a sociology major filled this void for me, and made me more sensitive to understanding social problems and the diversity and inequality among the populations I mapped. Although it is no longer my primary interest, I do enjoy making maps when they are part of a project. You can find more of my maps in my own publication on religious change in the U.S., as well as for a Pew Research Center report on religion and education around the world, and a recent report on resources for caregivers to loved ones with Alzheimer’s and dementia living in Northern Arizona.
Attending the 2010 Adventist World Session was a turning point for my research interests. I became aware that Seventh-day Adventists are among the most racially diverse and fastest growing religious group in the U.S. I was skeptical that the growth came from converting new members, and so I wrote a senior thesis about how the immigration of foreign-born members contributes to the American Church’s growth. When I joined the sociology and demography dual-degree graduate program at Penn State, I continued studying religion demography, which also allowed me to expand my research skills. I learned demographic techniques and statistical methods for analyzing social phenomenon in survey and census data. My Master’s thesis extended my previous work by focusing on how increasing racial-ethnic diversity in the U.S. presents a challenge to growth for white mainline and evangelical Protestants. Since then, I’ve dabbled in different topics like identifying ideal locations for new Amish settlements, or investigating the dietary patterns of Adventist immigrants living in enclaves and integrated neighborhoods. Religion demography is a relatively small field, so I am glad to have more opportunities to continue the topic of study at CMAC.
The way the average person interacts with demography is often through the U.S. Census. Can you explain how this type of survey works? What methods does the Census Bureau use and what do the results mean?
The U.S. Census Bureau has developed different versions of the decadal census form over the years. Since 1940 there has been a short form that collected basic questions from every single household and individual, and a long form that collected more detailed questions for a much smaller sample of the population. The American Community Survey (ACS) replaced the longform version of the census in 2005, and it surveys a sample of about 3.5 million people on an annual basis. The short census form is still only collected once a decade. The 2020 short form had just 10 questions, including the count of persons at the location, their age, sex, race, ethnicity and relationship to others in the house. This census was also the first time that the short form could be completed online, in addition to over the phone, by mail, or in-person with an official census taker.
Since everyone living in the U.S. is required by law to participate in the census, the results are the most accurate picture we have of the population count in each area of the country as of April 1st, 2020. The results are used for apportionment, which is the process of dividing the seats in the U.S. House of Representatives among the 50 states based on their population size. The new population estimates are also used to distribute funds from federal and local government programs.
What can the Census tell us about trends in religion? Or vice versa – how do trends in religion show up in Census data?
The U.S. is one of the few countries that does not collect any information on religion in the census or other federal data by law, although this has not always been the case. The Census Bureau did collect a special census of religious groups in 1906, 1916, 1926, and 1936. Non-government groups have conducted similar membership counts for each decade since 1952, but these kinds of data are limited in what they tell us. Not all religious groups participate each time, and since the data are not linked to the individuals counted in the decadal census, it is not possible to know the age, sex, or race of the people in each religious group. Nevertheless, these data can still identify the religious regions of the country (e.g. the Bible Belt), and where specific groups are growing or declining.
Religious trends are most noticeably reflected in ethnicity, immigration, and family size patterns in census data. For instance, the state of Utah is home to many Mormons, who prefer larger families because of their religious tradition. As a result, Utah ranks number one in household size and the percentage of the population under the age of 18. Historically, flows of European and Latin American Catholics have increased the ancestral, ethnic, and religious diversity of the cities and states where they settled. The same thing has happened more recently, as Hindu, Muslim, and Buddhist immigrants from the Middle East and Asia have come to live in different regions in the U.S.
What other sources or methods will you use to collect demographic data as part of the Modeling Religious Change project at CMAC?
Where census data fall short in measuring religion, surveys and polls pick up the slack. There are several surveys that ask respondents about religious affiliation or frequency of church attendance. We are prioritizing the surveys that used nationally representative sampling techniques; that is, the respondents in the survey aren’t from a single city or characteristic (e.g. only women or older people). The main survey we will use for the U.S. is the General Social Survey, which has collected measures on religion since the 1970s and has asked questions about the religiosity of participants during childhood and of their parents. We can use this retrospective data to extend our picture of religion in the U.S. to the early 1900s. If there is not good survey data, then we must use archived and qualitative data on religion. To measure religious change in Norway, for instance, we are analyzing the written life histories of older Norwegians in a Folk Memory Collection to identify how prevalent and important religion was in early 20th century Norway. In India we are using surveys and an ethnographic collection called the “People of India”. Integrating archived qualitative data and newer survey data poses its own challenge, but we are learning methods to make it work.
What stage of the project are you in now and what does that look like? What excites you about this work and what challenges are you facing?
It feels like we are in all stages simultaneously! On one front, we’ve been working on a basic microsimulation that can replicate other population projections like those produced by the United Nations or Pew Research Center, so that our model aligns with real-world data in terms of births, deaths, and international migration in each country. This has taken us longer than expected because there are so many differences in traditional projection methods and a microsimulation approach, but we are making exciting discoveries about the underlying assumptions of each approach.
For the religion measure collection effort, we are exploring the datasets we will use for each country and preparing them for analysis. These will provide more real-world data that we can use to validate our model when we incorporate religious change. We are still collecting and exploring the data, but we are closer to analysis in the U.S., India, and Norway. Our major challenge is integrating our patchwork of data sources into a single database. It involves learning a lot of new methods like “quantitizing” and it’s exciting to refine and expand our mixed methods approach.
We also have an ongoing theory group to develop a theoretical framework of religious change that will work in each country. Our major challenge there has been just that – developing a framework that will work in each country. This is a challenge because so much of the existing research and theory was developed for Europe and Western countries.
What outcomes do you want to see from the MRC project?
Right now, the end product of the MRC project seems like a magical black box that mysteriously predicts our religious future. Each day the box becomes more transparent as I learn more about how everything will work together. This project will make so many methodological, substantive, and unexpected contributions, that it’s difficult to pick out which ones I’m most excited about. I’d like to see interactive results, where we can change the assumptions about the future and see alternative model predictions about the religious landscape.
What are the best resources to learn more?
Bacon, R., Finke, R. and Jones, D. (2018) ‘Merging the religious congregations and membership studies: A data file for documenting American religious change’, Review of religious research, 60(3), pp. 403–422.
Bauer, J. T. (2012) ‘U.S. Religious Regions Revisited’, The Professional Geographer, 64(4), pp. 521–539. doi: 10.1080/00330124.2011.611429.
Bureau, U. C. ACS and the 2020 Census, The United States Census Bureau. https://www.census.gov/programs-surveys/acs/about/acs-and-census.html
Bureau, U. C. Uses of Census Bureau Data in Federal Funds Distribution, The United States Census Bureau. https://www.census.gov/library/working-papers/2017/decennial/census-data-federal-funds.html
US Census Bureau, C. H. S. Overview – History – U.S. Census Bureau. https://www.census.gov/history/www/through_the_decades/overview/
Everyday Sociology Blog: Sociology and the Census. https://www.everydaysociologyblog.com/2010/03/sociology-and-the-census.html
NW, 1615 L. St, Washington, S. 800 and Inquiries, D. 20036 U.-419-4300 | M.-419-4349 | F.-419-4372 | M. (2010) ‘A Brief History of Religion and the U.S. Census’, Pew Research Center’s Religion & Public Life Project, 26 January. https://www.pewforum.org/2010/01/26/a-brief-history-of-religion-and-the-u-s-census/
Thorvaldsen, G. (2014) ‘Religion in the Census’, Social Science History, 38(1–2), pp. 203–220.


