This is an article in our new series exploring and explaining the concepts that underlie our research. Many of our projects integrate highly involved, deeply technical theories and methods, which can be hard to understand without proper training. These posts are intended to break down those abstractions and put them in context.
Research in the social sciences often divides data into the categories of “quantitative” and “qualitative.” The quickest way to remember the difference between the two is that quantitative can be expressed and analyzed as a series of numbers, while qualitative data cannot. Here at CMAC, we use a mix of qualitative and quantitative methods across many of our projects. In this article, we’ll walk you through some of the key ideas in quantitative methods that guide our survey-based research, which you can see on display in Spectrums, the Sex Differences Project, and many others.
The Likert Scale
If you’ve ever taken an online survey, you’ve probably run across the Likert Scale, a tool that has become increasingly popular in social psychology. Rather than asking “yes” or “no” questions, the Likert Scale asks participants to rate their attitude towards a statement. Here’s a simple example of what this looks like in one of our surveys on ExploringMyReligion.org:
The purpose of prayer or meditation is to secure a happy and peaceful life.
Strongly Disagree 1 2 3 4 5 6 7 Strongly Agree
Here we’ve used the classic scale of “Agreement” but Likert Questions can be constructed along a number of dimensions, such as “Likelihood” (How likely are you to do X?) or “Concern” (How concerned are you about X?).
Using a 5 or 7-point scale rather than limiting it to yes/no options gives us a more nuanced appraisal of the intensity in the attitudes we want to measure. But let’s say we’re concerned that some individuals may respond differently due to how they interpret subtle differences in the wording of questions. In that case, we include several different questions that are intended to test the same underlying structure:
The primary purpose of prayer or meditation is to gain relief and protection.
Strongly Disagree 1 2 3 4 5 6 7 Strongly Agree
But, you might object, relief and protection is very different from happiness and peace! This is certainly true, but these questions enable us to measure overall attitudes towards a broader factor, in this case, “the efficacy and purposefulness of religious practice.” We might expect that respondents who believe that spiritual practice is more than just a symbolic ritual would rate both of these questions as “strongly agree.” Giving subjects multiple questions about a similar topic enables us to generate “scores” for them based on the average of their responses, which is a far more reliable approach than single responses. Sometimes reliability is checked by creating reliability item pairs, which are questions about the same topic but in the opposite direction, such as “I dislike red” and “I like red.” Reliable respondents answer such items in opposite ways.
A similar response pattern to questions designed to test for similar attitudes indicates that these questions have construct validity, meaning we are correct in assuming they actually measure similar things. For example, let’s say we had a theory that liking vanilla ice cream indicates a dislike of mint ice cream. If we conducted a survey and found that high scores on liking vanilla were not predictive of liking or disliking mint ice cream, then the theory underlying our research is either wrong or our questions are not well phrased.
No questionnaire is born perfect; items require careful testing to ensure that we see the expected patterns of scores on different questions based on the theories we want to test.
Other possible issues with online surveys might be that people do not read them carefully enough, or that a bot is spamming the survey. To combat that, we include what we call Catch and Calibration questions like this one:
When you decide whether a person’s action was right or wrong, it is relevant what that person’s favorite color is.
Strongly Disagree 1 2 3 4 5 6 7 Strongly Agree
Anything higher than a “Strongly Disagree” here would give us a reason to be skeptical about the reliability of that respondent. Such items also force respondents to use the extreme ends of the scale. Thus, they both catch and calibrate.
Factor Analysis
Let’s imagine that we surveyed a group of sports fans to find out which teams they like and dislike. Let’s also assume that for some reason as researchers, we are pretty ignorant about American sports fandom. We might get results like this:
| Red Sox | Celtics | Bruins | Patriots | Broncos | Rockies | Red Wings | Knicks | |
| Fan 1 | Fan | Fan | Fan | Fan | Not Fan | Not Fan | Not Fan | Not Fan |
| Fan 2 | Not Fan | Fan | Fan | Fan | Not Fan | Not Fan | Not Fan | Not Fan |
| Fan 3 | Not Fan | Not Fan | Not Fan | Not Fan | Fan | Fan | Not Fan | Not Fan |
| Fan 4 | Fan | Fan | Fan | Fan | Not Fan | Not Fan | Not Fan | Not Fan |
| Fan 5 | Not Fan | Not Fan | Not Fan | Not Fan | Not Fan | Not Fan | Fan | Not Fan |
| Fan 6 | Not Fan | Not Fan | Not Fan | Not Fan | Not Fan | Not Fan | Not Fan | Fan |
| Fan 7 | Fan | Fan | Fan | Fan | Not Fan | Not Fan | Not Fan | Not Fan |
| Fan 8 | Not Fan | Not Fan | Not Fan | Not Fan | Fan | Fan | Not Fan | Fan |
| Fan 9 | Fan | Fan | Fan | Not Fan | Not Fan | Not Fan | Fan | Not Fan |
| Fan 10 | Not Fan | Not Fan | Not Fan | Not Fan | Not Fan | Not Fan | Not Fan | Fan |
| Fan 11 | Fan | Fan | Fan | Fan | Not Fan | Not Fan | Not Fan | Not Fan |
| Fan 12 | Not Fan | Not Fan | Not Fan | Not Fan | Not Fan | Not Fan | Fan | Not Fan |
Immediately upon seeing these results, it is apparent that there are similar patterns of fandom among the first four teams as well as the fifth and sixth team. Why could this be? In this case the answer is obvious to anyone who knows the locations of these teams; fandom likely follows regional lines.
This is a very simple example of what is called a factor in statistical analysis, a latent or unmeasured variable that explains the variation in the variables measured by the survey. We could represent it visually like this.
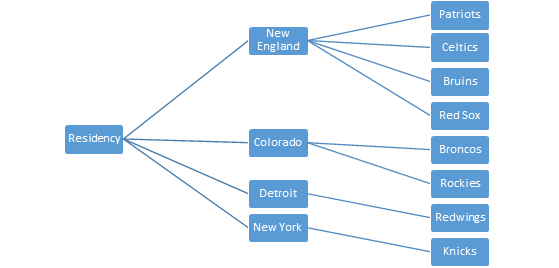
Detecting the factor (residency) in this case is easy because we already have a strong set of intuitions about the relationships between our measured variables of team fandom. But often relationships between our measured variables are not so clear-cut, and so we conduct a factor analysis, using statistical and computational tests to look for hidden structures.
Conventionally, a factor analysis can be either exploratory or confirmatory. Exploratory factor analysis searches for hidden variables that we don’t already know about, while confirmatory factor analysis evaluates the extent to which the measured variables fit together in the way we expect. For example, in testing and piloting the Multidimensional Religious Ideology survey, the Spectrums team utilized a confirmatory factor analysis to verify that their theoretical understanding of the structure of religious ideology matched the patterns of responses in the data. In testing and piloting the Dimensions of Spirituality Inventory, the team used an exploratory factor analysis to detect underlying structure in the 21 dimensions of spirituality measured.
Quantitative research always entails an ongoing tug-of-war between theory and data. Faced with unexpected hidden variables or strange responses, it is not always clear whether to be excited at a new discovery or frustrated at a faulty research design. Developing questionnaires and interpreting factor analyses is only productive when it is grounded in a clear set of ideas and hypotheses that are connected to a larger body of research. At CMAC, our mission is to develop new tools to quantify and measure complex facets of social life, and this should give you a few insights into how we test and refine our nets before casting them into the ocean of human experience.